Multiple Choice
The following figure shows studies in a stream where enclosures were set up either with trout or with no trout.Which statement is a correct interpretation of the graph about trout,invertebrates,and algae? 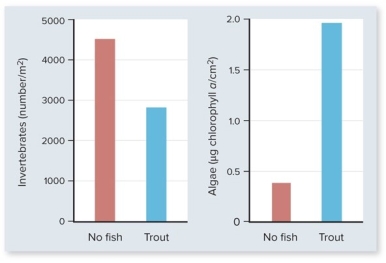
A) If trout are present in a system,algae production is low and invertebrate population levels are also low.
B) If trout are present in a system,algae production is high and invertebrate population levels are also high.
C) If trout are present in a system,algae production is high and invertebrate population levels are low.
D) Trout do not seem to affect the algae production; only the invertebrate populations are affected.
E) Trout do affect the algae production but not the invertebrate populations.
Correct Answer:

Verified
Correct Answer:
Verified
Q17: Which of the following groups do not
Q18: Which of the following hypotheses support the
Q19: Which one of the following factors would
Q20: Even though nitrogen constitutes 78% of Earth's
Q21: A(n)_ is a permeable underground layer of
Q23: The honey possum (Tarsipes rostratus)is a tiny
Q24: Only about _ of the sunlight falling
Q25: Phosphorus deficiency often appears early in plant
Q26: Energy enters most ecosystems by the process
Q27: In a marine ecosystem with an inverted