Multiple Choice
Which of the following is the best interpretation of the graph below of mussel size (x-axis) versus energy gain (line graph,left y-axis) ,and number of mussels eaten per day (histogram,right y-axis) ? 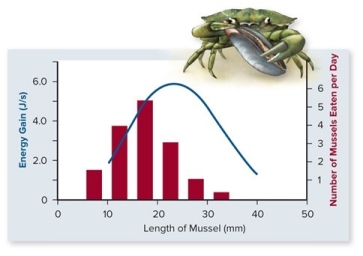
A) Mussels are selected as food sources by crabs.
B) Crabs select mussels in a way that maximizes their energy gain.
C) Mussel size does not seem to be a good predictor as to which mussel hungry crabs will select.
D) Crabs tend to consume most of the largest mussels.
E) Crabs prefer the mussels with the smallest length for their food resources.
Correct Answer:

Verified
Correct Answer:
Verified
Q18: Correctly rephrase the following famous quote from
Q19: Artificial selection and hybridization can demonstrate the
Q20: In which of the following examples has
Q21: What is the evolutionary advantage of extra-pair
Q22: By evaluating and selecting mates with superior
Q24: It is 6:00 PM and the sun
Q25: Foraging behaviors are those having to do
Q26: At a research conference,you meet a graduate
Q27: Which of the following are used by
Q28: Alarm calling seems to be an example