Multiple Choice
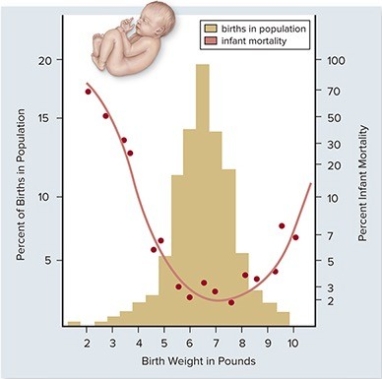 In the graph above,how can the change in infant mortality be explained as birth weight increases from 2 to 7 pounds?
A) A larger baby will have more developed organs and thus have greater fitness.
B) A baby closer to 7 pounds will not be able to be delivered safely and thus have higher mortality.
C) A baby closer to 7 pounds will have more developed organs and thus have higher mortality.
D) A baby closer to 7 pounds will have more developed organs and thus have lower mortality.
E) A baby closer to 2 pounds will not be able to be delivered safely and thus have lower mortality.
Correct Answer:

Verified
Correct Answer:
Verified
Q12: An insect population that becomes resistant to
Q13: Moths that can evade a bat's echolocation
Q15: <img src="https://d2lvgg3v3hfg70.cloudfront.net/TB7721/.jpg" alt=" The percentage of
Q16: Being born with extra fingers on a
Q18: About 80% of the alleles present in
Q19: In early ancestors of the modern giraffe,longer
Q20: Cheetahs have been through a genetic bottleneck;
Q21: _ would keep a population in Hardy-Weinberg
Q22: By evaluating and selecting mates with superior
Q22: Male Mormon crickets choose larger females as