Not Answered
Explain the relationship between the two plotted variables in Figure 8.14. How can egg development and laying occur prior to the end of May if there is a relation between the mean date of laying and average temperatures for May? 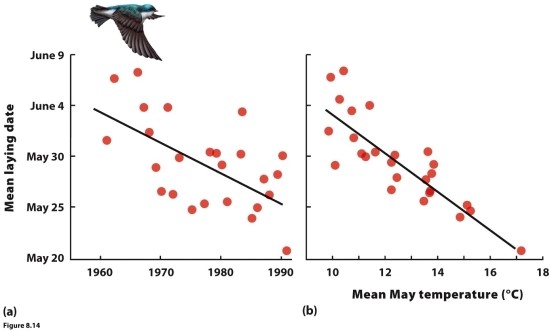
Correct Answer:

Verified
Correct Answer:
Verified
Q12: Grime proposed that combinations of life history
Q13: Reproductive trade-offs that an organism might face
Q14: Is senescence inevitable? Please explain your answer,
Q15: In human females the increased prevalence of
Q16: If maintaining high survival and reproduction would
Q18: Yucca plants are mostly iteroparous, but some
Q19: Many life history events are matched to
Q20: Which does NOT have slow life history
Q21: Fecundity is the<br>A) number of reproductive episodes
Q22: For some organisms, warmer spring temperatures have