Not Answered
The data in the figure show a relationship between the mean flowering date for many plant species around Concord, New Hampshire, and the mean spring temperature over a time span exceeding 150 years. However, there is a lot of scatter around the best-fit line in panel b. What information in the chapter might suggest the source of this scatter, and what does it imply about the plant species' cues for flowering? 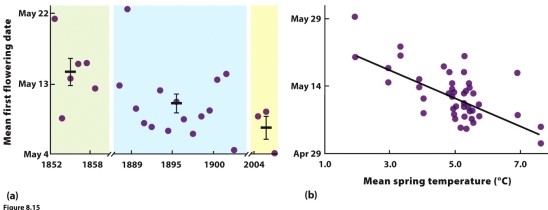
Correct Answer:

Verified
Correct Answer:
Verified
Q56: What is the reproduction pattern of most
Q57: Which of the following does NOT apply
Q58: Explain two significant ways in which environmental
Q59: Some marine snails (species L) produce large
Q60: Explain the main life history trait that
Q62: Red foxes mature after their first year
Q63: Which variable best summarizes the response to
Q64: Using Grime's categories, describe the general environment
Q65: Which of the following is NOT a
Q66: Bet hedging (spreading reproduction over both good