Multiple Choice
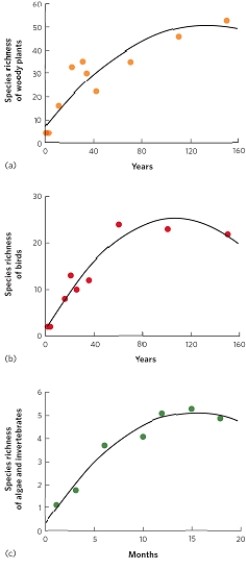 (Figure 19.11) These graphs show that succession is associated with a rapid increase in species richness that slows and levels off over time. How might you explain a graph showing succession with an initial increase in species richness followed by a decline in species richness over time?
A) a disturbance such as fire
B) facilitation
C) inhibition
D) tolerance
Correct Answer:

Verified
Correct Answer:
Verified
Q44: Succession is best studied using<br>A) indirect observations.<br>B)
Q45: Grazers can change climax communities because they<br>A)
Q46: Suppose that seeds from large canopy trees
Q47: A sequence of communities that exist over
Q48: The assumptions behind the valid use of
Q50: Terrestrial primary succession begins with<br>A) lichens and
Q51: When succession was initially observed on the
Q52: In some areas of the western United
Q53: It is known that as succession progresses
Q54: A pioneer species is _ species to