Not Answered
Researchers examined data collected between 1985 and 2006 on diversity of fish in the North Sea, average bottom temperatures, and how species diversity was affected by temperature. According to the figure, what did they find? What did they conclude about the cause of the change in fish diversity? 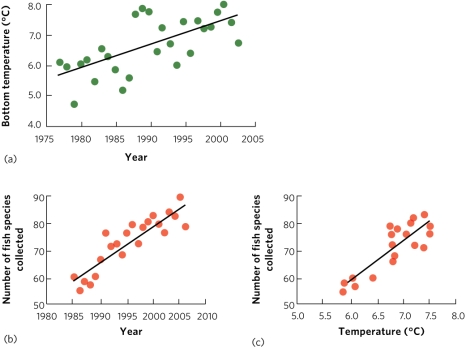
Correct Answer:

Verified
Correct Answer:
Verified
Q9: Species with very large geographic ranges that
Q10: During the annual Christmas bird count conducted
Q11: The range of abiotic conditions under which
Q12: Which of the following is an example
Q13: Which of the following populations would be
Q15: Which model specifically addresses the situation where
Q16: Why does reduction of a population lead
Q17: What is not true about a species'
Q18: Dispersal limitation occurs when<br>A) there has not
Q19: Methods such as area-based, volume-based, and line-transect