Multiple Choice
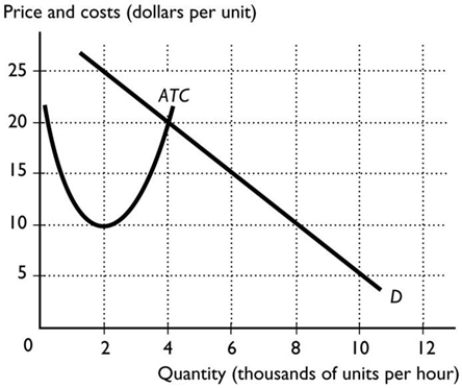
-The figure above shows the market demand curve and the ATC curve for a firm. If all firms in the market have the same ATC curve, the efficient scale for one firm is ________ units per hour.
A) 2,000
B) 10,000
C) 8,000
D) 4,000
E) more than 10,000
Correct Answer:

Verified
Correct Answer:
Verified
Q61: If Polka Cola agrees to sell its
Q62: <img src="https://d2lvgg3v3hfg70.cloudfront.net/TB7671/.jpg" alt=" -The table above
Q63: Which of the following does trade practices
Q64: Resale price maintenance can be illegal<br>A) under
Q65: Which of the following is found ONLY
Q66: Under what conditions would it be legal
Q68: The equilibrium in the prisoners' dilemma i.
Q69: Sammy's Pty Ltd competes with a few
Q70: <img src="https://d2lvgg3v3hfg70.cloudfront.net/TB7671/.jpg" alt=" -The only two
Q71: <img src="https://d2lvgg3v3hfg70.cloudfront.net/TB7671/.jpg" alt=" -Suppose Intel and