Multiple Choice
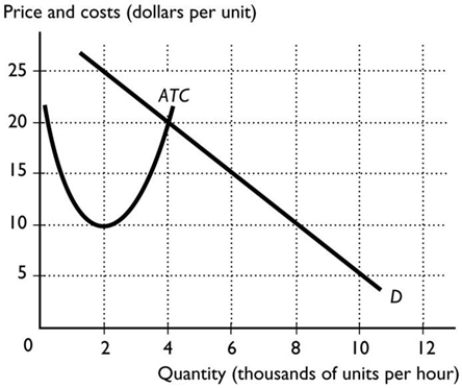
-The figure above shows the market demand curve and the ATC curve for a firm. If all firms in the market have the same ATC curve, the lowest price at which a firm could stay in business in the long run is ________ per unit and the quantity demanded in the market at that price is ________ units per hour.
A) $20; 8,000
B) $20; 2,000
C) $20; 4,000
D) $10; 8,000
E) $10; 4,000
Correct Answer:

Verified
Correct Answer:
Verified
Q25: A cartel is<br>A) a market with only
Q26: If firms in an oligopolistic industry consistently
Q27: <img src="https://d2lvgg3v3hfg70.cloudfront.net/TB7671/.jpg" alt=" -The table above
Q28: Which of the following is an example
Q29: <img src="https://d2lvgg3v3hfg70.cloudfront.net/TB7671/.jpg" alt=" -The fact that
Q31: If the Herfindahl-Hirschman Index (HHI) for a
Q32: <img src="https://d2lvgg3v3hfg70.cloudfront.net/TB7671/.jpg" alt=" -The mobile-phone market
Q33: The possible alternatives for an oligopoly range
Q34: _ is an agreement between a manufacturer
Q35: <img src="https://d2lvgg3v3hfg70.cloudfront.net/TB7671/.jpg" alt=" -Collusion results when