Multiple Choice
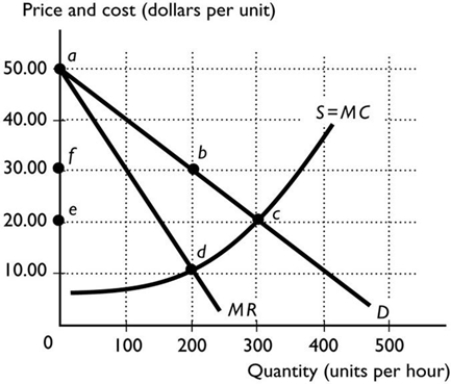
-The figure above shows the demand curve, marginal revenue curve, and marginal cost curve. The deadweight loss when the market has a monopoly producer is
A) bcd.
B) bcef.
C) acd.
D) ace.
E) abf.
Correct Answer:

Verified
Correct Answer:
Verified
Q46: Monopolies are inefficient because, at the profit-maximising
Q47: <img src="https://d2lvgg3v3hfg70.cloudfront.net/TB7671/.jpg" alt=" -The figure above
Q48: Compared to a single-price monopoly, when a
Q49: Which of the following is a legal
Q51: <img src="https://d2lvgg3v3hfg70.cloudfront.net/TB7671/.jpg" alt=" -The table above
Q52: If a monopoly wants to sell a
Q53: Which of the following is NOT correct
Q54: Patents<br>A) remove legal barriers to entry.<br>B) are
Q55: A natural monopoly<br>A) is a firm than
Q257: A natural monopoly's average cost curve i.