Multiple Choice
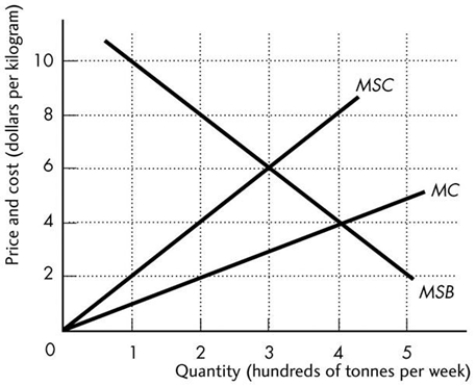
-The above figure shows the marginal private cost curve, marginal social cost curve, and marginal social benefit curve for blue fin tuna, a common resource. The market equilibrium with no government intervention is
A) zero tonnes per week.
B) 500 tonnes per week.
C) 400 tonnes per week.
D) 200 tonnes per week.
E) None of the above answers is correct.
Correct Answer:

Verified
Correct Answer:
Verified
Q38: <img src="https://d2lvgg3v3hfg70.cloudfront.net/TB7671/.jpg" alt=" -The above figure
Q39: The efficient quantity of a public good
Q40: For which type of good is it
Q41: Which of the following is the best
Q42: Government bureaucracies over-provide public goods and grow
Q44: <img src="https://d2lvgg3v3hfg70.cloudfront.net/TB7671/.jpg" alt=" -The above figure
Q45: <img src="https://d2lvgg3v3hfg70.cloudfront.net/TB7671/.jpg" alt=" -The table above
Q46: Suppose a public good is provided in
Q47: Which of the following is an example
Q48: The fact that Zoe's enjoyment of a