Multiple Choice
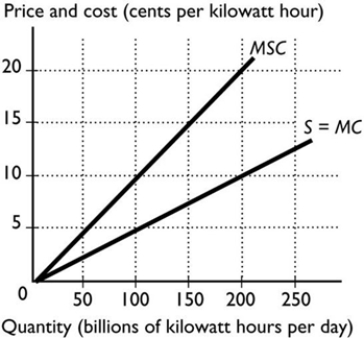
-The figure above shows the marginal social cost curve of generating electricity and the marginal private cost curve. The marginal cost borne by producers when 100 billion kilowatt hours are produced is
A) 10 cents per kilowatt hour.
B) 15 cents per kilowatt hour.
C) 5 cents per kilowatt hour.
D) 0 cents per kilowatt hour.
E) 20 cents per kilowatt hour.
Correct Answer:

Verified
Correct Answer:
Verified
Q10: <img src="https://d2lvgg3v3hfg70.cloudfront.net/TB7671/.jpg" alt=" -The figure above
Q11: The cost of producing an additional unit
Q12: The cost of producing an additional unit
Q13: <img src="https://d2lvgg3v3hfg70.cloudfront.net/TB7671/.jpg" alt=" -The figure above
Q14: A subsidy is<br>A) a payment that the
Q16: <img src="https://d2lvgg3v3hfg70.cloudfront.net/TB7671/.jpg" alt=" -The figure above
Q17: If the marginal private benefit of attending
Q18: Which of the following equations is correct?<br>A)
Q19: <img src="https://d2lvgg3v3hfg70.cloudfront.net/TB7671/.jpg" alt=" -The figure above
Q20: <img src="https://d2lvgg3v3hfg70.cloudfront.net/TB7671/.jpg" alt=" -In order for