Multiple Choice
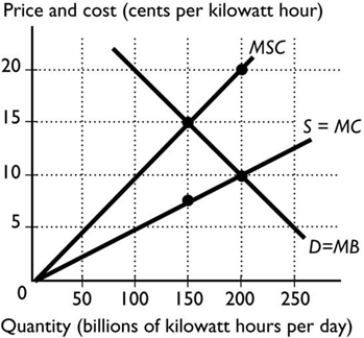
-The figure above shows the marginal social cost curve of generating electricity, the marginal private cost curve, and the demand curve. If the market is competitive and unregulated, the equilibrium price is ________ per kilowatt hour and the equilibrium quantity is ________ billion kilowatt hours per day.
A) 10 cents; 200
B) 20 cents; 100
C) 7.5 cents; 150
D) 15 cents; 150
E) 20 cents; 200
Correct Answer:

Verified
Correct Answer:
Verified
Q82: For a product with external benefits that
Q83: If a product has zero external costs,
Q84: <img src="https://d2lvgg3v3hfg70.cloudfront.net/TB7671/.jpg" alt=" -The figure above
Q85: <img src="https://d2lvgg3v3hfg70.cloudfront.net/TB7671/.jpg" alt=" -The figure above
Q86: <img src="https://d2lvgg3v3hfg70.cloudfront.net/TB7671/.jpg" alt=" -If a pollution
Q88: Suppose scientific research generates external benefits. Without
Q89: Pollution is an example of a _
Q90: <img src="https://d2lvgg3v3hfg70.cloudfront.net/TB7671/.jpg" alt=" -The figure above
Q91: If a polluting producer is forced to
Q92: <img src="https://d2lvgg3v3hfg70.cloudfront.net/TB7671/.jpg" alt=" -The figure above