Multiple Choice
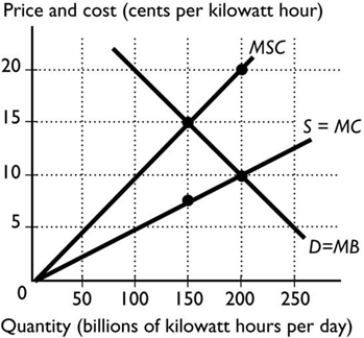
-The figure above shows the marginal social cost curve of generating electricity, the marginal private cost curve, and the demand curve. If the government imposes a pollution tax to achieve the efficient level of production, the tax equals ________ per kilowatt hour.
A) 2.5 cents
B) 0 cents
C) 15 cents
D) 7.5 cents
E) 10 cents
Correct Answer:

Verified
Correct Answer:
Verified
Q88: Suppose scientific research generates external benefits. Without
Q89: Pollution is an example of a _
Q90: <img src="https://d2lvgg3v3hfg70.cloudfront.net/TB7671/.jpg" alt=" -The figure above
Q91: If a polluting producer is forced to
Q92: <img src="https://d2lvgg3v3hfg70.cloudfront.net/TB7671/.jpg" alt=" -The figure above
Q94: Which of the following is the best
Q95: Firm A and Firm B emit 300
Q96: The deadweight loss associated with producing a
Q97: <img src="https://d2lvgg3v3hfg70.cloudfront.net/TB7671/.jpg" alt=" -The figure above
Q98: If the production of a good causes