Multiple Choice

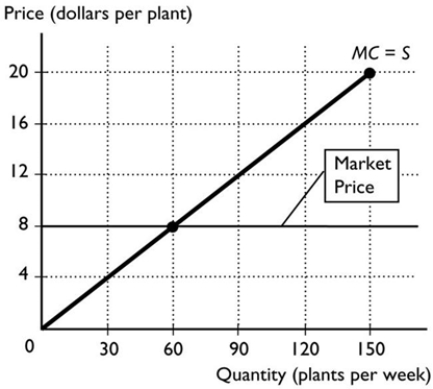
-The figure above shows the supply curve for soft drink. The market price is $1.00 per soft drink. The marginal cost of the 10,000th soft drink is
A) $1.00.
B) $0.00.
C) $0.50.
D) more than $0.50 and less than $1.00.
E) None of the above answers is correct.
Correct Answer:

Verified
Correct Answer:
Verified
Q57: The supply curve of a good or
Q58: <img src="https://d2lvgg3v3hfg70.cloudfront.net/TB7671/.jpg" alt=" -In the figure
Q59: Allocating resources by the order of someone
Q60: If marginal benefit is equal to marginal
Q61: When the cost of producing a product
Q63: <img src="https://d2lvgg3v3hfg70.cloudfront.net/TB7671/.jpg" alt=" -The figure above
Q64: In general, the marginal cost curve<br>A) is
Q65: Deadweight loss and market failure are created
Q66: Allocative efficiency refers to<br>A) producing the goods
Q67: Subsidies _ the price paid by the