Multiple Choice
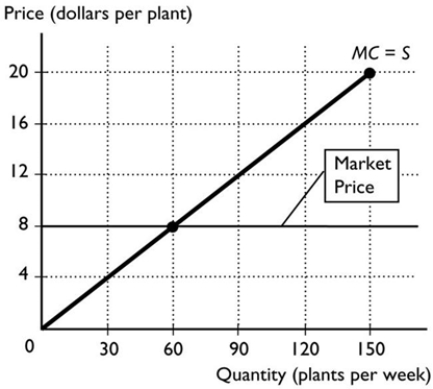
-The figure above shows the supply curve for soft drink. The market price is $1.00 per soft drink. The producer surplus from the 10,000th soft drink is
A) $0.00.
B) $1.00.
C) $0.50.
D) more than $1.00.
E) None of the above answers is correct.
Correct Answer:

Verified
Correct Answer:
Verified
Q42: The figure above shows Kaley's marginal benefit
Q43: <img src="https://d2lvgg3v3hfg70.cloudfront.net/TB7671/.jpg" alt=" -The figure above
Q44: Allocative efficiency is achieved when the marginal
Q45: The 'invisible hand' refers to the notion
Q46: The Adelaide Football Club reserves 5,000 free
Q48: As more of a good is consumed,
Q49: <img src="https://d2lvgg3v3hfg70.cloudfront.net/TB7671/.jpg" alt=" -The figure above
Q50: <img src="https://d2lvgg3v3hfg70.cloudfront.net/TB7671/.jpg" alt=" -In the figure
Q51: Which of the following statements is correct?<br>A)
Q52: To achieve allocative efficiency, an economy<br>A) must