Multiple Choice
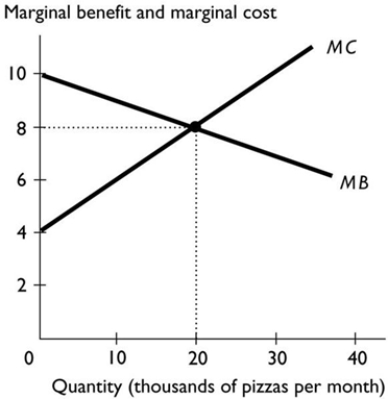
-The figure above shows the marginal benefit and marginal cost curves for pizza. In the figure, what is the efficient quantity of pizza?
A) 20,000 pizzas
B) 30,000 pizzas
C) 0 pizzas
D) 10,000 pizzas
E) The efficient quantity cannot be determined without more information.
Correct Answer:

Verified
Correct Answer:
Verified
Q1: <img src="https://d2lvgg3v3hfg70.cloudfront.net/TB7671/.jpg" alt=" -The figure above
Q3: At a competitive equilibrium, if there are
Q4: A benefit that accrues to people other
Q5: <img src="https://d2lvgg3v3hfg70.cloudfront.net/TB7671/.jpg" alt=" -In the figure
Q6: <img src="https://d2lvgg3v3hfg70.cloudfront.net/TB7671/.jpg" alt=" -In the above
Q7: <img src="https://d2lvgg3v3hfg70.cloudfront.net/TB7671/.jpg" alt=" -In the above
Q8: Which of the following is part of
Q9: <img src="https://d2lvgg3v3hfg70.cloudfront.net/TB7671/.jpg" alt=" -In the figure
Q10: Jake just bought a new hockey stick.
Q11: When society produces the combination of goods