Multiple Choice
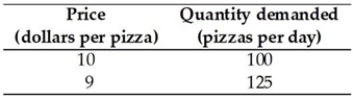
-The data in the table above give two points on the demand curve for pizza. Using the midpoint method, when the price of a pizza falls from $10 to $9, what is the percentage change in price?
A) 1.0 per cent
B) 8.2 per cent
C) 5.0 per cent
D) 15.5 per cent
E) 10.5 per cent
Correct Answer:

Verified
Correct Answer:
Verified
Related Questions
Q2: The income elasticity of demand for skiing
Q3: You own a small store. Your cashier
Q4: Goods that can be produced at a
Q5: The income elasticity of demand is _
Q6: If the cross elasticity of demand for
Q8: Perfectly inelastic demand means that consumers<br>A) will
Q9: Suppose the current price of barley is
Q10: If the price elasticity of demand for
Q11: If the price of beef increased by
Q12: When the price of going to a