Multiple Choice
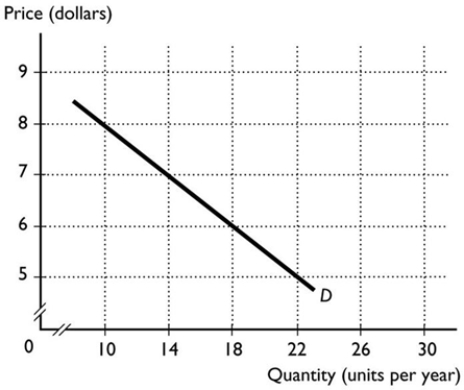
-In the figure above, using the midpoint method, the price elasticity of demand when the price falls from $7 to $6 is equal to
A) 0.40.
B) 2.50.
C) 0.62.
D) 1.00.
E) 1.63.
Correct Answer:

Verified
Correct Answer:
Verified
Related Questions
Q18: <img src="https://d2lvgg3v3hfg70.cloudfront.net/TB7671/.jpg" alt=" -Using the data
Q19: When the percentage change in the quantity
Q20: A 10 per cent increase in price
Q21: To determine the price elasticity of demand,
Q22: For which of the following would the
Q24: Which of the following explains why supply
Q25: The price elasticity of supply measures<br>A) the
Q26: <img src="https://d2lvgg3v3hfg70.cloudfront.net/TB7671/.jpg" alt=" -Using the table
Q27: If the supply of a good decreases
Q28: If a 20 per cent increase in