Multiple Choice
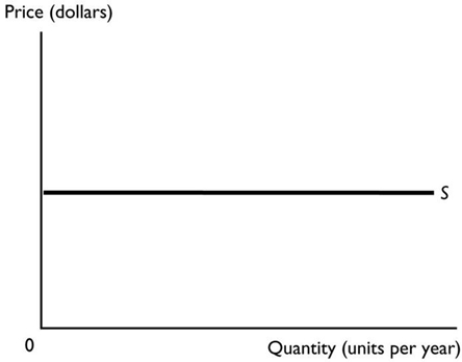
-The figure above shows the supply curve for a good with
A) a perfectly inelastic supply.
B) an inelastic supply.
C) a unit elastic supply.
D) a perfectly elastic supply.
E) an elastic supply.
Correct Answer:

Verified
Correct Answer:
Verified
Related Questions
Q112: Suppose the price of a silk tie
Q113: If the price of a good rises,
Q114: Which of the following is correct?<br>A) The
Q115: If the percentage change in price is
Q116: Which of the following is correct? i.
Q118: Suppose the Adelaide Crows football team raises
Q119: If demand is inelastic and the price
Q120: Patrick lives near two petrol stations, Caltex
Q121: <img src="https://d2lvgg3v3hfg70.cloudfront.net/TB7671/.jpg" alt=" -Based on the
Q122: Which of the following is most likely