Multiple Choice
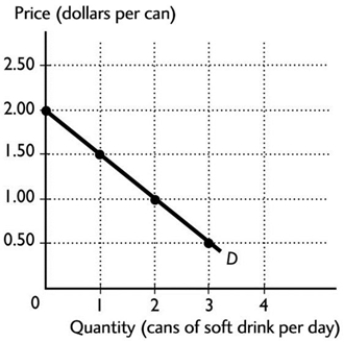 The graph illustrates the demand curve for soft drinks. After a rise in the price of a soft drink from $1.00 a can to $2.00 a can, the quantity of soft drinks demanded
A) decreases from 1 can to 0 cans a day.
B) remains unchanged.
C) increases from 0 cans to 2 cans a day.
D) decreases from 2 cans to 0 cans a day.
E) cannot be determined from the figure because the demand curve will shift to a new curve.
Correct Answer:

Verified
Correct Answer:
Verified
Q9: If a market begins in equilibrium and
Q10: Which of the following results in a
Q11: <img src="https://d2lvgg3v3hfg70.cloudfront.net/TB7671/.jpg" alt=" The figure above
Q12: <img src="https://d2lvgg3v3hfg70.cloudfront.net/TB7671/.jpg" alt=" According to the
Q13: Soft drinks and peanuts are complements. Other
Q15: Consumers regard Dell computers and Apple computers
Q16: <img src="https://d2lvgg3v3hfg70.cloudfront.net/TB7671/.jpg" alt=" The graph illustrates
Q17: A market is defined as<br>A) a physical
Q18: <img src="https://d2lvgg3v3hfg70.cloudfront.net/TB7671/.jpg" alt=" In the above
Q19: <img src="https://d2lvgg3v3hfg70.cloudfront.net/TB7671/.jpg" alt=" The above figure