Multiple Choice
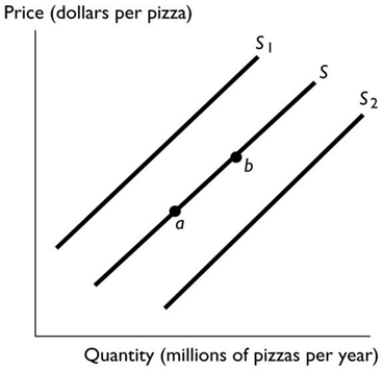 In the above figure, the movement from point a to point b reflects
A) an increase in the number of producers of pizza.
B) a decrease in the cost of the tomato sauce used to produce pizza.
C) a decrease in income if pizza is a normal good.
D) an increase in the supply of pizza.
E) an increase in the price of pizza.
Correct Answer:

Verified
Correct Answer:
Verified
Q45: <img src="https://d2lvgg3v3hfg70.cloudfront.net/TB7671/.jpg" alt=" The above figure
Q48: When laptops were first produced, the price
Q49: eBay<br>A) is not a market because buyers
Q51: If there is a surplus of a
Q52: The number of people looking to buy
Q53: Teenagers drink more soft drinks than other
Q54: If macaroni and cheese is an inferior
Q55: If both producers and consumers believe that
Q65: <img src="https://d2lvgg3v3hfg70.cloudfront.net/TB1458/.jpg" alt=" -Pizza is a
Q103: <img src="https://d2lvgg3v3hfg70.cloudfront.net/TB1458/.jpg" alt=" -The number of