Multiple Choice
 In the above figure, the shift in the supply curve from S to S2 reflects
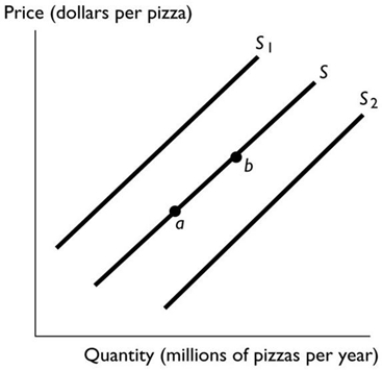
A) a decrease in the supply of pizza AND a simultaneous decrease in the quantity of pizza supplied.
B) a decrease in the quantity of pizza supplied.
C) an increase in the quantity of pizza supplied.
D) an increase in the supply of pizza.
E) a decrease in the supply of pizza.
Correct Answer:

Verified
Correct Answer:
Verified
Q129: Which of the following does NOT increase
Q130: The law of demand implies that, other
Q131: If the price is below the equilibrium
Q132: Researchers have found a hybrid of corn
Q133: Suppose the equilibrium price and quantity of
Q134: A decrease in the price of a
Q135: The downward slope of a demand curve<br>A)
Q136: If the Motor Vehicle Builders' Union successfully
Q137: <img src="https://d2lvgg3v3hfg70.cloudfront.net/TB7671/.jpg" alt=" Scooters and bicycles
Q139: When demand increases and supply decreases by