Multiple Choice
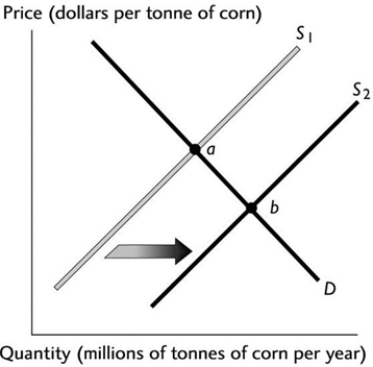 The above figure illustrates the market for corn. If point 'a' represents the original equilibrium and point 'b' the new equilibrium, which of the following could have caused the change?
A) An increase in consumers' preferences for corn.
B) An increase in the labour costs of producing corn.
C) An increase in consumers' income if corn is a normal good.
D) An improvement in the technology of producing corn.
E) An increase in consumers' income if corn is an inferior good.
Correct Answer:

Verified
Correct Answer:
Verified
Q20: What is the 'quantity demanded'?<br>A) The amount
Q21: <img src="https://d2lvgg3v3hfg70.cloudfront.net/TB7671/.jpg" alt=" A construction boom
Q22: Which of the following increases the supply
Q23: It is expected that the price of
Q24: Kiwi fruit and strawberries are substitutes for
Q26: For consumers, corn chips and salsa are
Q27: The market demand curve<br>A) cannot show a
Q28: One reason supply curves have an upward
Q29: Using the data in the table above,
Q30: Which of the following shifts the supply