Multiple Choice
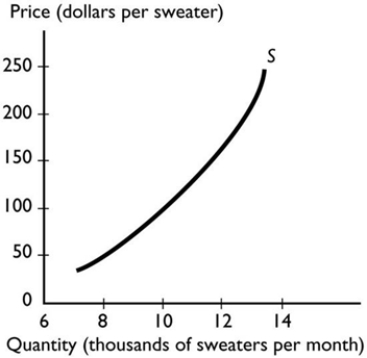 The graph illustrates the supply of sweaters. A fall in the price of sweaters brings
A) a movement along the supply curve.
B) a decrease in the quantity supplied of sweaters.
C) a shift of the supply curve.
D) Both answers A and B are correct.
E) Both answers B and C are correct.
Correct Answer:

Verified
Correct Answer:
Verified
Q60: Advances in productivity increase supply because they
Q61: Suppose a medical study reveals new benefits
Q62: Bagels and cream cheese are complementary goods.
Q63: If an early frost destroys most of
Q64: <img src="https://d2lvgg3v3hfg70.cloudfront.net/TB7671/.jpg" alt=" In the figure
Q66: The quantity supplied of a good or
Q67: The law of supply states that, other
Q68: Suppose over the next few years the
Q69: Assume that pizza and tacos are substitutes,
Q70: Changes in which of the following factors