Multiple Choice
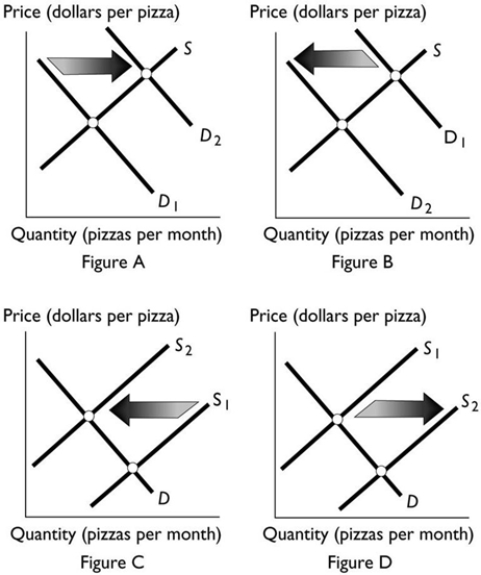 Which figure above shows the effect of a decrease in the number of pizza sellers?
A) Figure A
B) Figure B
C) Figure C
D) Figure D
E) Both Figure B and Figure C
Correct Answer:

Verified
Correct Answer:
Verified
Q78: <img src="https://d2lvgg3v3hfg70.cloudfront.net/TB7671/.jpg" alt=" The above figure
Q79: Consider the market for smart phones. Which
Q80: <img src="https://d2lvgg3v3hfg70.cloudfront.net/TB7671/.jpg" alt=" The figure above
Q81: Suppose the current price of a kilogram
Q82: Suppose the price of bread rises. This
Q84: <img src="https://d2lvgg3v3hfg70.cloudfront.net/TB7671/.jpg" alt=" In the above
Q85: Scooters are a normal good and buyers'
Q86: The graph illustrates the demand for peanuts.
Q87: In a recession, consumers have less income
Q88: The demand for cat food decreases while