Essay
A refrigeration and heating company-one that installs and repairs home central air and heating systems-has asked your advice on how to analyse their service quality. They have logged customer complaints. Here's a recent sampling. Use the supplied template to construct a conventional cause-and-effect diagram. Place each of the complaints onto a main cause; justify your choice with a brief comment as necessary. 1. "I was overcharged-your labour rates are too high." 2. "The repairman left trash where he was working." 3. "You weren't here when you said you would be. You should call when you must be late." 4. "Your repairman smoked in my house."5. "The part you installed is not as good as the factory original." 6. "Your repairman was here for over two hours, but he wasn't taking his work seriously." 7. "You didn't tighten some of the fittings properly-the system's leaking." 8. "Your estimate of repair costs was WAY off." 9. "I called you to do an annual inspection, but you've done more-work that I didn't authorize." 10. "Your mechanic is just changing parts-he doesn't have a clue what's really wrong." 11. "Your bill has only a total-I wanted to see detail billing." 12. "Your testing equipment isn't very new-are you sure you've diagnosed the problem?"13. "One of the workmen tracked mud into my living room." 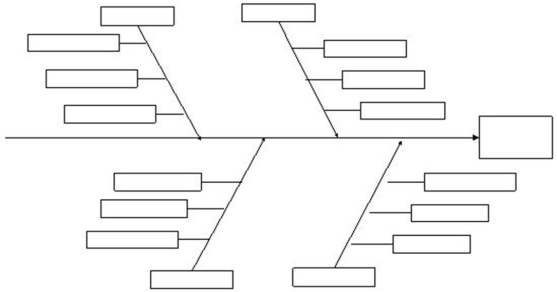
Correct Answer:

Verified
Individual responses may vary. A typical...View Answer
Unlock this answer now
Get Access to more Verified Answers free of charge
Correct Answer:
Verified
View Answer
Unlock this answer now
Get Access to more Verified Answers free of charge
Q15: Create a Pareto Chart for the
Q16: When a sample measurement falls inside the
Q20: Calculate the Quality loss function from the
Q21: A pizza delivery company wants to improve
Q22: Calculate the Quality loss function from the
Q23: To become ISO 9000 certified, organizations must<br>A)
Q71: Line employees need the knowledge of TQM
Q73: Quality "lies in the eyes of the
Q162: A good description of source inspection is
Q184: _ are graphical presentations of data over