Multiple Choice
The diagram below shows the demand and supply curves for refrigerators in Canada. 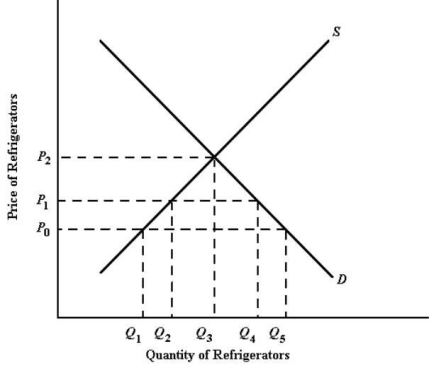 FIGURE 33-1 Refer to Figure 33-1.At the price P0,the quantity of refrigerators supplied to the Canadian market by domestic Canadian producers is
A) Q1.
B) Q2.
C) Q3.
D) Q4.
E) Q5.
Correct Answer:

Verified
Correct Answer:
Verified
Related Questions
Q1: Canada is a net importer of durable
Q2: The diagram below shows the domestic demand
Q3: An agreement among a group of countries
Q4: The diagram below shows the domestic demand
Q6: Canada is a net importer of durable
Q7: Suppose five countries in Central America agree
Q8: The diagram below shows the domestic demand
Q9: What is typically the main objective of
Q10: What is meant by the concept of
Q11: Consider the following statement: "Canadians on average