Multiple Choice
The diagram below shows the demand and supply curves for refrigerators in Canada. 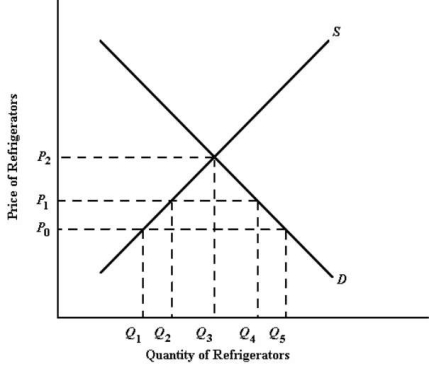 FIGURE 33-1 Refer to Figure 33-1.Suppose P0 is the world price.If Canada imposes a tariff causing the price of refrigerators in Canada to rise from P0 to P1,the Canadian government will collect tariff revenues equal to
A) the original price P0,multiplied by the original quantity of refrigerators imported into Canada,Q1Q5.
B) (P1 - P0) multiplied by the tariff-induced quantity of refrigerators imported into Canada,Q1Q5.
C) (P1 - P0) multiplied by the tariff-induced quantity of refrigerators imported into Canada,Q2Q4.
D) the new price,P1,multiplied by the total quantity of refrigerators purchased in Canada,Q4.
E) the new price,P1,multiplied by the total quantity of refrigerators purchased in Canada,Q2.
Correct Answer:

Verified
Correct Answer:
Verified
Q42: The diagram below shows the domestic demand
Q43: Consider the infant-industry argument for trade protection.In
Q44: The diagram below shows the demand and
Q45: Over the long run,protecting a domestic industry
Q46: Suppose the Canadian government began subsidizing wheat
Q48: Canadian governments (provincial and federal)currently provide enormous
Q49: A country can improve its own terms
Q50: (NAFTA is currently being renegotiated,but was still
Q51: Suppose Canada eliminates a 15% tariff on
Q52: The diagram below shows the domestic demand