Multiple Choice
This table shows how much wine and cheese can each be produced in Spain and Portugal with one unit of equivalent resources.Initially there is no trade.Once trade opens up,transportation costs are assumed to be zero. 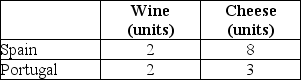 TABLE 32-5 Refer to Table 32-5.The opportunity cost of cheese in terms of wine is
A) 1/4 in Spain.
B) 4 in Spain.
C) 2 in each country.
D) 3/2 in Portugal.
E) 3 in Portugal.
Correct Answer:

Verified
Correct Answer:
Verified
Q112: The table below shows hypothetical Canadian domestic
Q113: If,over a period of a year,a country's
Q114: The diagram below shows Robinson Crusoe's annual
Q115: The following production possibilities schedule shows the
Q116: The diagram below shows the domestic demand
Q118: Consider the following information about the production
Q119: The following production possibilities schedule shows the
Q120: Suppose Spain is currently producing 90 units
Q121: If Country A has a comparative advantage
Q122: Suppose Spain is currently producing 90 units