The Figure Below Shows Arcticland's Annual Production Possibilities Boundary for the Production
Multiple Choice
The figure below shows Arcticland's annual production possibilities boundary for the production of fish and ice. 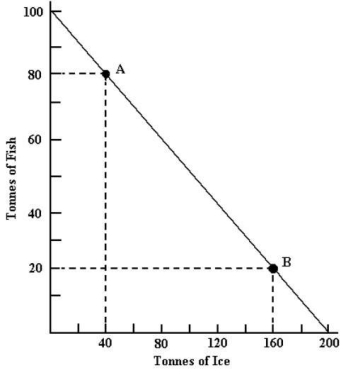 FIGURE 32-4 Refer to Figure 32-4.Starting from point A and moving to point B,the opportunity cost of producing each additional tonne of ice is
A) increasing.
B) increasing followed by decreasing.
C) constant.
D) decreasing.
E) decreasing followed by increasing.
Correct Answer:

Verified
Correct Answer:
Verified
Q38: Australia exports wine to Canada,and Canada exports
Q39: The following production possibilities schedule shows the
Q40: The figure below shows Arcticland's annual production
Q41: The figure below shows Arcticland's annual production
Q42: The following production possibilities schedule shows the
Q44: International trade permits a country to<br>A)produce and
Q45: Ireland and Japan are assumed to produce
Q46: If Canada has an absolute advantage in
Q47: The figure below shows Arcticland's annual production
Q48: The following production possibilities schedule shows the