Multiple Choice
The diagram below shows the budget deficit function for a government in a hypothetical economy. 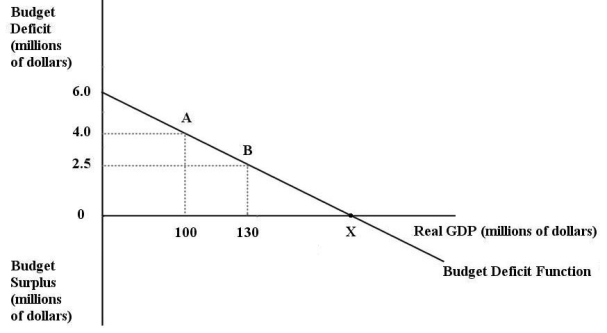 FIGURE 31-1 Refer to Figure 31-1.Initially,suppose real GDP is $100 million and the budget deficit is $4 million,as shown by point A on the graph.Which of the following is consistent with a move from point A to point B?
A) implementation of an expansionary fiscal policy
B) implementation of a contractionary fiscal policy
C) implementation of a contractionary monetary policy
D) the economy entering into a recession
E) the economy entering into a boom
Correct Answer:

Verified
Correct Answer:
Verified
Q95: Consider the following variables: G = government
Q96: Consider the government's budget constraint.The accumulated stock
Q97: If the economy goes into a recession,the
Q98: Consider the government's budget deficit function,graphed with
Q99: Suppose the stock of government debt in
Q101: Consider the following variables: G = government
Q102: The diagram below shows the budget deficit
Q103: Suppose the real rate of interest is
Q104: An annually balanced government budget is a
Q105: What economists call "government saving",or "public saving"