Multiple Choice
The diagram below shows two budget deficit functions for a hypothetical economy. 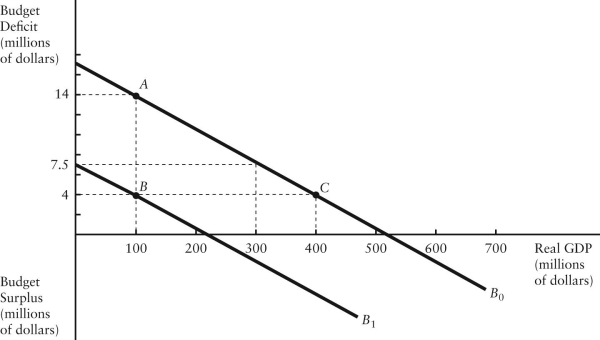 FIGURE 31-2 Refer to Figure 31-2.Initially,suppose the economy is at point A on budget deficit function
  .Real GDP (Y) is $100 million.If the level of potential output (Y*) were $300 million,the structural budget deficit would be
A) $2 million.
B) $14 million.
C) measured by the vertical distance between the horizontal axis and  (at real GDP = 300) .
D) measured by the vertical distance between point A and the budget deficit that would exist at real GDP = 300 million.
E) Insufficient information to know.
Correct Answer:

Verified
Correct Answer:
Verified
Q77: The government's annual primary budget deficit is
Q78: The best measure of the change in
Q79: Consider the government's budget deficit function.Other things
Q80: A simple equation describing the government's budget
Q81: Consider a government with an outstanding stock
Q83: The table below shows government purchases (G),net
Q84: Suppose legislation in Canada required annually balanced
Q85: Consider the following data about government debt
Q86: The Canadian tax and transfer system acts
Q87: Consider a closed-economy AD/AS model.If an increase