Multiple Choice
The diagram below shows two budget deficit functions for a hypothetical economy. 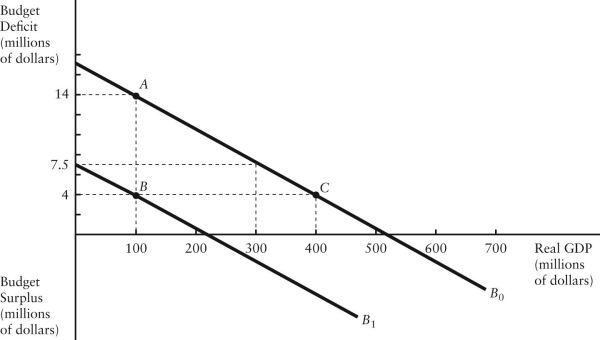 FIGURE 31-2 Refer to Figure 31-2.Initially,suppose the economy is at point A on budget deficit function
  .Real GDP (Y) is $100 million.If the level of potential output (Y*) were $400 million,the structural budget deficit would be
A) $14 million.
B) $4 million.
C) negative.
D) -$10 million.
E) $0.
Correct Answer:

Verified
Correct Answer:
Verified
Q17: If the government's total budget deficit is
Q18: Consider two economies,A and B.Economy A has
Q19: Until the onset of the most recent
Q20: The government's primary budget deficit (or surplus)is
Q21: The diagram below is for a closed
Q23: What is the federal government's "primary budget
Q24: The concept of "national saving" refers to
Q25: The diagram below shows two budget deficit
Q26: Suppose during one fiscal year,government purchases are
Q27: The diagram below shows the budget deficit