Multiple Choice
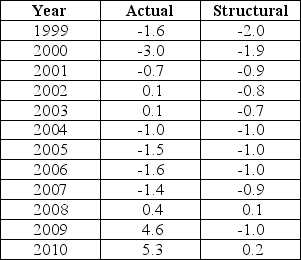
The data below provides the Actual and Structural Budget Deficits,as a percentage of real GDP,for Canada between 1999 and 2010.Note that a negative value in the table indicates a budget surplus.  TABLE 31-2 Refer to Table 31-2.Based on the data in the table,in which of the following years was output greater than potential?
A) 1999
B) 2004
C) 2000
D) 2008
E) 2010
Correct Answer:

Verified
Correct Answer:
Verified
Q64: In an open economy like Canada's,a policy-induced
Q65: The Canadian federal debt-to-GDP ratio reached a
Q66: Consider two economies,A and B.Economy A has
Q67: The table below shows government purchases (G),net
Q68: Decreasing government expenditures in order to reduce
Q70: If voters want to know how their
Q71: In any given year,the government's debt-service payments
Q72: An annually balanced government budget would tend
Q73: Consider the government's debt-to-GDP ratio.A significant reason
Q74: Suppose that in Year 2 there was