Multiple Choice
The table below shows real GDP,potential GDP and the unemployment rate for a hypothetical economy. 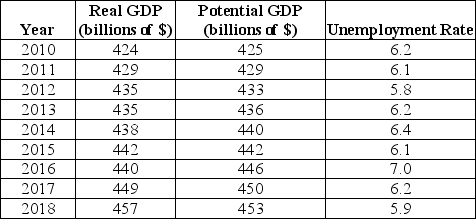 TABLE 30-3 Refer to Table 30-3.In which year is the cyclical unemployment equal to 0.3%?
A) 2014
B) 2015
C) 2016
D) 2017
E) 2018
Correct Answer:

Verified
Correct Answer:
Verified
Q85: The labour market in the diagram below
Q86: The theory of "efficiency wages" suggests that
Q87: An unemployed worker can be identified as
Q88: Long-term labour contracts are an important feature
Q89: A good example of an outcome that
Q91: The table below provides hypothetical unemployment,employment,and labour
Q92: Unemployment rates among workers in the 15-24
Q93: The table below shows real GDP,potential GDP
Q94: One motivation for having publicly subsidized retraining
Q95: The table below provides hypothetical unemployment,employment,and labour