Multiple Choice
The table below shows the percentage of the labour force accounted for by males and females over a two-decade period.Assume that real GDP is equal to potential in each of the given years. % of Labour Force 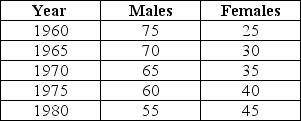 TABLE 30-4
Refer to Table 30-4.Suppose that for each year listed the unemployment rate among males is 5% while it is 7% among females.What is the economy's NAIRU in 1975?
A) 5.0%
B) 5.5%
C) 5.6%
D) 5.7%
E) 5.8%
Correct Answer:

Verified
Correct Answer:
Verified
Q10: The economy in the diagram below begins
Q11: Non-market-clearing theories of unemployment emphasize wage stickiness.Wage
Q12: The table below provides hypothetical unemployment,employment,and labour
Q13: If labour markets had perfectly flexible wages,as
Q14: The labour market in the diagram below
Q16: Which of the following statements best explains
Q17: Which of the following is a central
Q18: Consider Canada's employment insurance (EI)program,which provides benefits
Q19: An unemployed worker can be identified as
Q20: Retaining a core group of experienced employees