Multiple Choice
The table below shows the percentage of the labour force accounted for by males and females over a two-decade period.Assume that real GDP is equal to potential in each of the given years. % of Labour Force 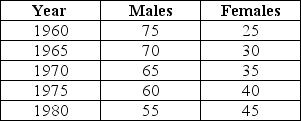 TABLE 30-4
Refer to Table 30-4.Suppose that for each year listed the unemployment rate among males is 5% while it is 7% among females.Which of the following statements correctly describes the change in the NAIRU in this economy between 1960 and 1980?
A) Since females account for a smaller percentage of the labour force in all years,the NAIRU is decreasing over time.
B) The NAIRU remains constant between 1960 and 1980 because the unemployment rates for males and females remain constant.
C) Since females have a higher unemployment rate,the NAIRU increases over time as the female share in the labour force increases.
D) Since real GDP is equal to potential GDP in all years,cyclical unemployment is equal to zero,and therefore the NAIRU does not change.
E) Since males have a lower unemployment rate,and they make up a larger percentage of the labour force,the NAIRU is decreasing over time.
Correct Answer:

Verified
Correct Answer:
Verified
Q108: Suppose a free-trade agreement with Central America
Q109: Suppose there are 2000 unemployed textile workers
Q110: An increase in the rate of aggregate
Q111: Other things being equal,a macroeconomic shock that
Q112: The market-clearing and non-market-clearing theories of unemployment
Q113: The labour market in the diagram below
Q114: When real GDP is less than potential
Q115: One reason that economists are interested in
Q117: The normal turnover of workers and the
Q118: The economy in the diagram below begins