Multiple Choice
The three figures below show the phases of a disinflation.In part (i) ,the economy is experiencing a sustained inflation at E1. 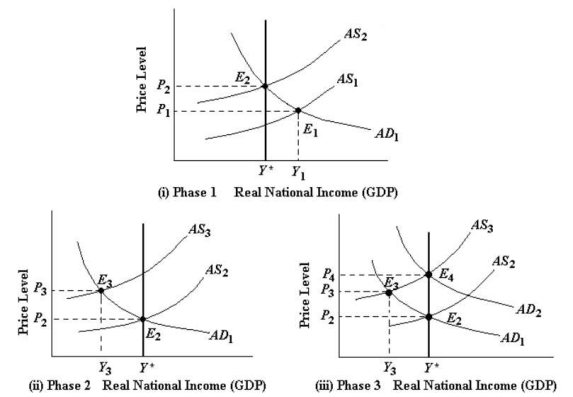 FIGURE 29-4 Refer to Figure 29-4,part (iii) .Consider the recovery phase of the disinflation process when output is returning from Y3 to Y*.Real GDP can return to potential either by ________,or by ________.
A) the AS curve falling slowly back to AS2; further monetary contraction which shifts the AD curve to AD2
B) the AS curve falling slowly back to AS2; a monetary expansion which shifts the AD curve to AD2
C) fiscal policy which causes the AS curve to shift back to AS2; a monetary expansion which shifts the AD curve to AD2
D) legislating a wage-and-price freeze which shifts the AS curve back to AS2; a further contraction of monetary policy which shifts the AD curve to AD2
E) the AS curve drifting upward to AS3; the AD curve drifting back to AD1
Correct Answer:

Verified
Correct Answer:
Verified
Q103: Consider an economy that is in the
Q104: It is often said that inflation is
Q105: The reason that some economists advise central
Q106: A constant inflation rate can be illustrated
Q107: Suppose the NAIRU for Canada is 6.5%,and
Q109: At the end of the 1970s,the inflation
Q110: <img src="https://d2lvgg3v3hfg70.cloudfront.net/TB7713/.jpg" alt=" FIGURE 29-2 Refer
Q111: Suppose the economy is currently in long-run
Q112: Suppose the NAIRU for Canada is 6.5%,the
Q113: Consider the AD/AS model below with a