Multiple Choice
The three figures below show the phases of a disinflation.In part (i) ,the economy is experiencing a sustained inflation at E1. 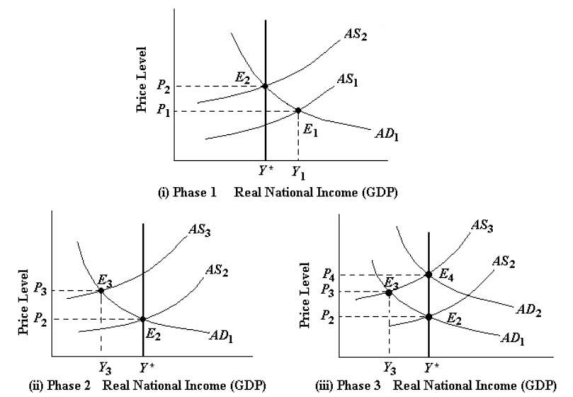 FIGURE 29-4 Refer to Figure 29-4,part (ii) or (iii) .A movement of the economy from E3 to E2 could be due to
A) a slow fall in wages due to the recessionary gap.
B) an expansionary monetary policy.
C) a contractionary monetary policy.
D) a rise in unit costs caused by falling wages.
E) a positive aggregate demand shock.
Correct Answer:

Verified
Correct Answer:
Verified
Q66: Consider the AD/AS model with a constant
Q67: Consider an economy without any supply shocks.If
Q68: Other things being equal,which of the following
Q69: Suppose we know the following information about
Q70: A leftward shift in the AD curve
Q72: "Supply inflation" refers to<br>A)inflation arising from a
Q73: The act of "monetary validation" by a
Q74: Which of the following will lead to
Q75: The Phillips curve originally appeared to demonstrate
Q76: If the NAIRU is 8% and the