Multiple Choice
The diagram below shows alternate paths for two hypothetical economies,each starting with GDP of $1 billion.Assume that Area 1 is equal to Area 2. 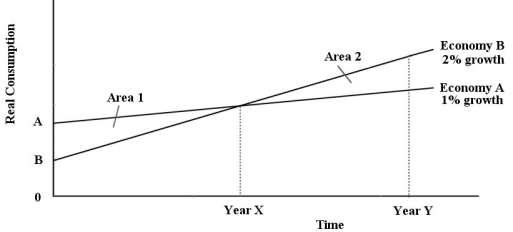 FIGURE 25-1 Refer to Figure 25-1.Which of the following statements best describes what we know about the difference between the two economies at Year 0?
A) Economy A has a higher level of real GDP at Year 0 than Economy B.
B) Economy B's households are consuming a larger percentage of GDP than Economy A's households.
C) There is no opportunity cost for economic growth for Economy B at Year 0.
D) There is no opportunity cost of economic growth for Economy A at Year 0.
E) Economy A's households are consuming a larger percentage of GDP than Economy B's households.
Correct Answer:

Verified
Correct Answer:
Verified
Q3: According to the Neoclassical growth theory,sustained rising
Q4: Which of the following is a central
Q5: Neoclassical growth theory is based on the
Q6: The diagram below show the market for
Q7: The diagram below shows the market for
Q9: The table below shows aggregate values for
Q10: According to the Neoclassical growth model,which of
Q11: Modern or "new" theories of long-run economic
Q12: What is the main reason that alleviation
Q13: According to the "new" theories of economic