Multiple Choice
The diagram below shows alternate paths for two hypothetical economies,each starting with GDP of $1 billion.Assume that Area 1 is equal to Area 2. 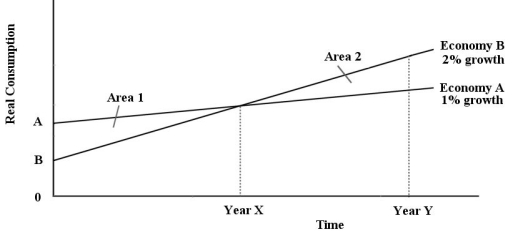 FIGURE 25-1 Refer to Figure 25-1.The area marked Area 1 represents
A) the value of consumption from Year 0 to Year X in Economy A.
B) the value of the investment in capital goods undertaken by Economy B.
C) the value of the investment in capital goods undertaken by Economy A.
D) the sacrifice of current consumption by Economy B,as compared to Economy A.
E) the sacrifice of current consumption by Economy A,as compared to Economy B.
Correct Answer:

Verified
Correct Answer:
Verified
Q68: Consider the competing products made by Apple
Q69: According to some modern theories of long-run
Q70: Which of the following is a cost
Q71: For a given level of technology,a more
Q72: Consider a closed economy in the long
Q74: The table below shows aggregate values for
Q75: One reason that investment in innovation is
Q76: In new theories of "endogenous growth," increasing
Q77: Consider the long-run theory of investment,saving,and growth.For
Q78: Consider the newer theories of economic growth.Given