Multiple Choice
The diagram below shows alternate paths for two hypothetical economies,each starting with GDP of $1 billion.Assume that Area 1 is equal to Area 2. 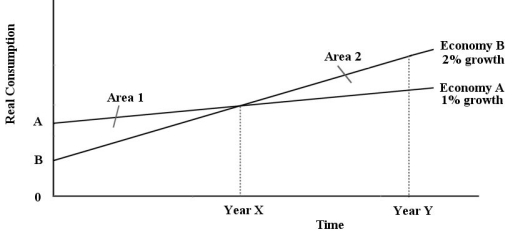 FIGURE 25-1 Refer to Figure 25-1.Which of the following costs of economic growth are reflected in this diagram?
A) the sacrifice of current consumption
B) lower real interest rate
C) environmental degradation
D) resource exhaustion
E) national saving
Correct Answer:

Verified
Correct Answer:
Verified
Q18: The diagram below shows alternate paths for
Q19: Consider the significant costs to the innovators
Q20: The diagram below shows the market for
Q21: If government policies are to be successful
Q22: The Neoclassical growth model assumes that,with a
Q24: Which of the following equations is a
Q25: Suppose most of the world's population would
Q26: "Embodied technical change" is said to occur
Q27: Compared to Neoclassical growth theory,newer "endogenous growth"
Q28: Over a long period of time,perhaps many