Multiple Choice
The table below shows data for five economies of similar size.Real GDP is measured in billions of dollars.Assume that potential output for each economy is $340 billion. 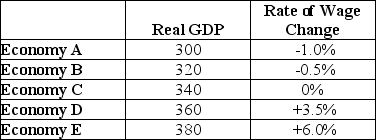 TABLE 24-1 Refer to Table 24-1.How is the adjustment asymmetry demonstrated when comparing Economy A to Economy E?
A) The size of the output gap is the same in Economies A and E,but wages are rising in A and falling in E.
B) The output gap is larger in Economy A,yet wages are changing more slowly.
C) The output gap is much larger in Economy E,so wages are changing at a faster rate.
D) The size of the output gap is the same in Economies A and E but wages are falling more slowly in A than they are rising in E.
E) There is insufficient data with which to observe the adjustment asymmetry.
Correct Answer:

Verified
Correct Answer:
Verified
Q136: If the economy is experiencing an inflationary
Q137: The table below shows data for five
Q138: Consider the basic AD/AS model,and suppose there
Q139: <img src="https://d2lvgg3v3hfg70.cloudfront.net/TB7713/.jpg" alt=" FIGURE 24-1 Refer
Q140: Suppose the economy has a high level
Q142: Suppose the economy is initially in a
Q143: The diagram below shows an AD/AS model
Q144: How do we define the economy's output
Q145: Consider the basic AD/AS macro model in
Q146: Which of the following would occur as