Multiple Choice
The diagram below shows an AD/AS model for a hypothetical economy.The economy begins in long-run equilibrium at point A. 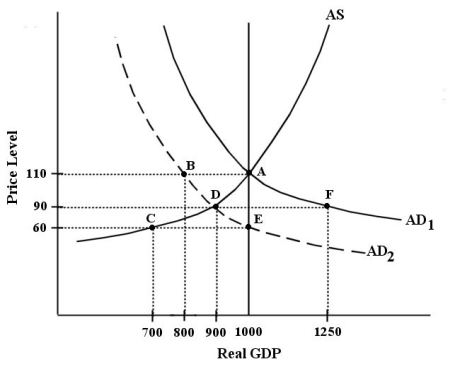 FIGURE 24-3 Refer to Figure 24-3.After the negative aggregate demand shock shown in the diagram (from
  to
to  ) ,which of the following describes the adjustment process that would return the economy to its long-run equilibrium?
A) Wages would eventually fall,causing the AD curve to shift to the right,returning to the original equilibrium at point A.
B) Wages would eventually fall,causing the AS curve to shift slowly to the right,reaching a new equilibrium at point E.
C) Wages would increase,causing the AS curve to shift to the right,reaching a new equilibrium at point E.
D) Wages would increase,causing the AD curve to shift to the right,returning to the original equilibrium at point A.
E) Potential output would decrease from 1000 to 900 and a new long-run equilibrium would be established at point D.
Correct Answer:

Verified
Correct Answer:
Verified
Q40: <img src="https://d2lvgg3v3hfg70.cloudfront.net/TB7713/.jpg" alt=" FIGURE 24-2 Refer
Q41: The Phillips curve describes the relationship between
Q42: The diagram below shows an AD/AS model
Q43: When we study the adjustment process in
Q44: Consider the basic AD/AS macro model in
Q46: The diagram below shows an AD/AS model
Q47: Which of the following describes the distinction
Q48: Which of the following statements about fiscal
Q49: Which of the following best describes the
Q50: Consider the AD/AS model,and suppose that the