Multiple Choice
The diagram below shows an AD/AS model for a hypothetical economy.The economy begins in long-run equilibrium at point A. 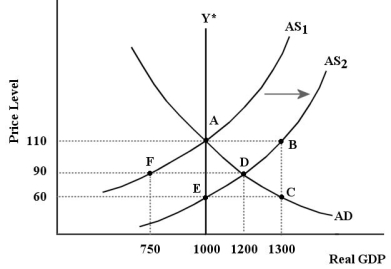 FIGURE 24-4 Refer to Figure 24-4.After the positive aggregate supply shock shown in the diagram,which of the following would shift the AS curve leftward during the economy's adjustment process?
A) an increase in factor supplies
B) an increase in the unemployment rate
C) a decrease in wages and other factor prices
D) an increase in labour productivity
E) an increase in wages and other factor prices
Correct Answer:

Verified
Correct Answer:
Verified
Q101: "The level of potential output,Y*,acts like an
Q102: In any decision about stimulating the economy
Q103: <img src="https://d2lvgg3v3hfg70.cloudfront.net/TB7713/.jpg" alt=" FIGURE 24-1 Refer
Q104: A recessionary output gap implies that<br>A)the demand
Q105: Consider a simple macro model with demand-determined
Q107: Which of the following is occurring as
Q108: Consider the basic AD/AS model,and suppose there
Q109: Consider the AD/AS macro model.An important asymmetry
Q110: Suppose the economy is in macroeconomic equilibrium
Q111: Suppose the economy begins in a long-run