Multiple Choice
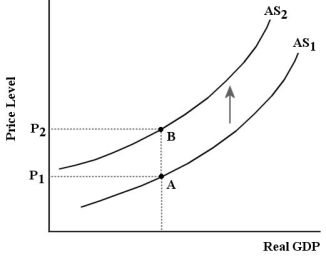 FIGURE 23-2 Refer to Figure 23-2.The shift from AS1 to AS2 shown in the diagram is referred to as a(n)
A) increase in aggregate supply.
B) increase in unit costs.
C) negative aggregate supply shock.
D) positive aggregate supply shock.
E) decrease in unit costs.
Correct Answer:

Verified
Correct Answer:
Verified
Q97: Which of the following will cause a
Q98: Consider the basic AD/AS model with an
Q99: Consider the simple multiplier when the price
Q100: Other things being equal,as the price level
Q101: Consider two economies,A and B.Economy A has
Q103: The economy's aggregate supply (AS)curve shows the
Q104: Suppose there is a drop in the
Q105: Suppose the economy is hit by a
Q106: <img src="https://d2lvgg3v3hfg70.cloudfront.net/TB7713/.jpg" alt=" FIGURE 23-1 Refer
Q107: Other things being equal,an economy with a