Multiple Choice
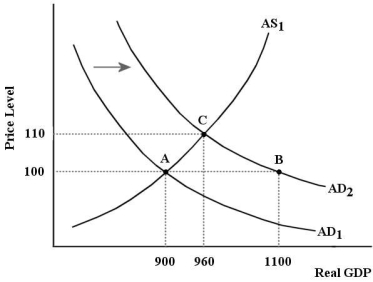 FIGURE 23-5 Refer to Figure 23-5.Suppose that an increase in autonomous investment caused the AD curve to shift to the right,as shown.If the simple multiplier in this model is 4,then how much was the increase in investment?
A) 30
B) 40
C) 50
D) 12
E) not enough information to know
Correct Answer:

Verified
Correct Answer:
Verified
Q2: Which of the following explains why we
Q3: Aggregate supply shocks cause the price level
Q4: <img src="https://d2lvgg3v3hfg70.cloudfront.net/TB7713/.jpg" alt=" FIGURE 23-5 Refer
Q5: Consider the AD/AS model.Suppose there is a
Q6: Which of the following events would cause
Q8: Consider the economy's aggregate supply curve.Other things
Q9: Consider the following news headline: "Governments plan
Q10: In the basic AD/AS model,the effect of
Q11: <img src="https://d2lvgg3v3hfg70.cloudfront.net/TB7713/.jpg" alt=" FIGURE 23-3 Refer
Q12: In the short run,the aggregate supply curve