Multiple Choice
The diagram below shows desired aggregate expenditure for a hypothetical economy.Assume the following features of this economy: • marginal propensity to consume (mpc) = 0.80
• net tax rate (t) = 0.15
• no foreign trade
• fixed price level
• all expenditure and income figures are in billions of dollars. 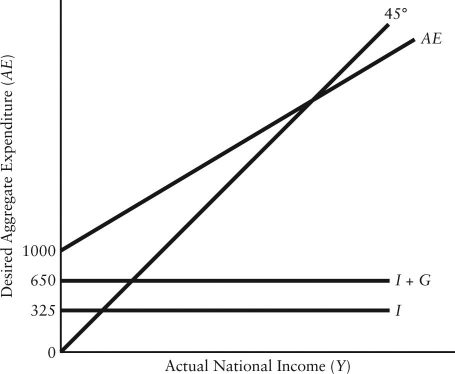 FIGURE 22-3
Refer to Figure 22-3.What is total autonomous expenditure?
A) $300
B) $325
C) $650
D) $1000
E) $1975
Correct Answer:

Verified
Correct Answer:
Verified
Q47: Consider a simple macro model with a
Q48: Consider the following simple macro model with
Q49: Consider the following news headline: "Finance minister
Q50: Consider a simple macro model with a
Q51: A decrease in domestic national income will
Q53: In our simple macro model with government,consider
Q54: In a simple macro model,it is generally
Q55: Consider the government's budget balance.Suppose G =
Q56: The table below shows national income and
Q57: <img src="https://d2lvgg3v3hfg70.cloudfront.net/TB7713/.jpg" alt=" FIGURE 22-5 Refer