Multiple Choice
The diagram below shows desired aggregate expenditure for a hypothetical economy.Assume the following features of this economy: • marginal propensity to consume (mpc) = 0.80
• net tax rate (t) = 0.15
• no foreign trade
• fixed price level
• all expenditure and income figures are in billions of dollars. 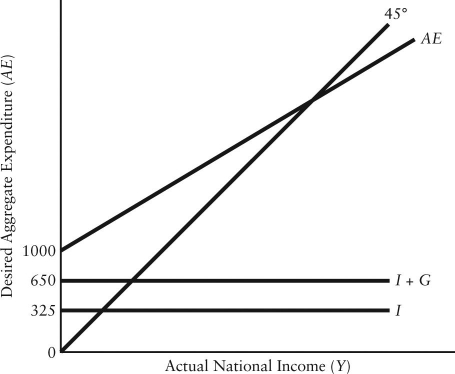 FIGURE 22-3
Refer to Figure 22-3.What is the marginal propensity to spend (z) in this economy?
A) 0.45
B) 0.48
C) 0.65
D) 0.68
E) 0.80
Correct Answer:

Verified
Correct Answer:
Verified
Q69: Suppose real national income (Y)is equal to
Q70: Transfer payments made by the government affect
Q71: Consider a model with demand-determined output and
Q72: Consider a simple macro model with a
Q73: In our simple macro model with government
Q75: Consider a simple macro model with a
Q76: The table below shows national income and
Q77: Consider a simple macro model with a
Q78: Consider a simple macro model with a
Q79: Consider a simple macro model with a